Little River County, Arkansas
This page analyzes election data for Little River County, Arkansas.
Examining how turnout rates in Little River County compare to other counties in Arkansas
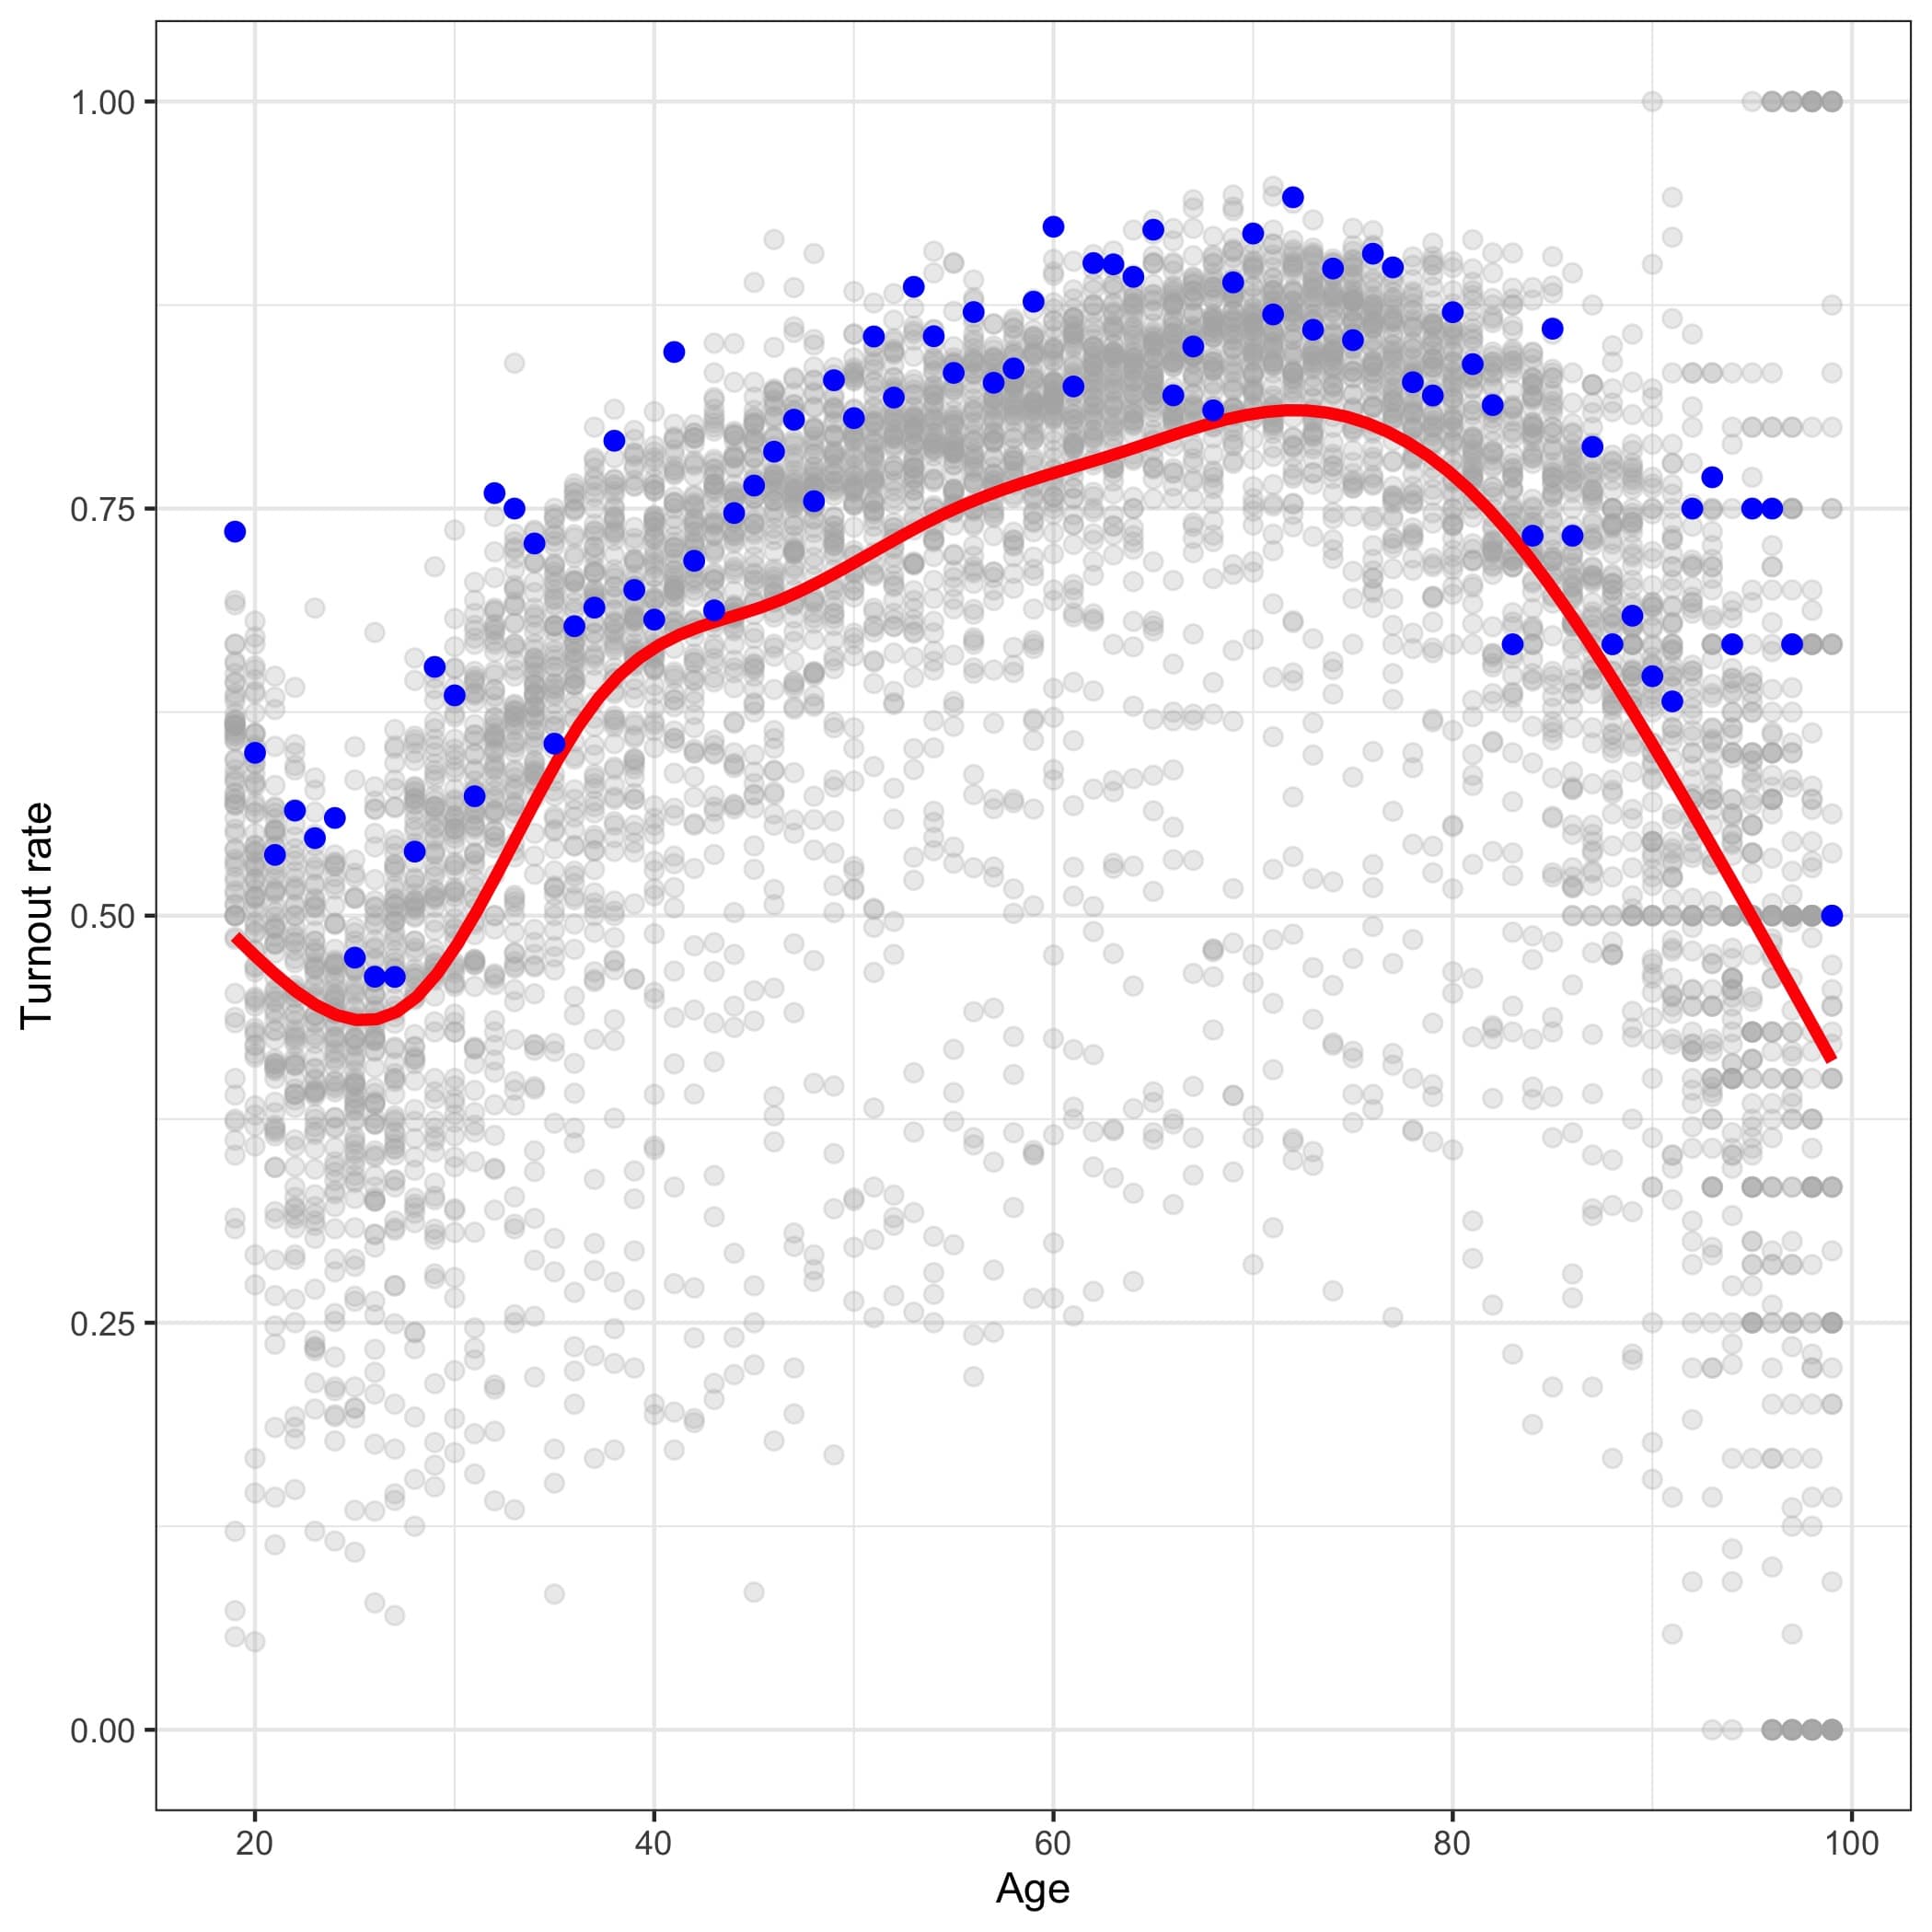
This plot below shows all of the counties’ turnout rates for each age and the statewide average highlighted in red. The Little River County turnout rate is highlighted with blue points.
Notice that across Arkansas there is considerable variation in the turnout rate for every age group across counties. Also, notice that the Little River County turnout rate is not perfectly aligned with the statewide average. This contradicts Doug Frank’s claim that there is a single turnout rate in each state.
Demonstrating that Douglas Frank’s Method Exaggerates its Predictive Power in Little River County
Douglas Frank regularly shows plots comparing his prediction of the turnout count and the actual turnout count when he visits a county. Using these plots, he claims to uncover an “unnatural” relationship.
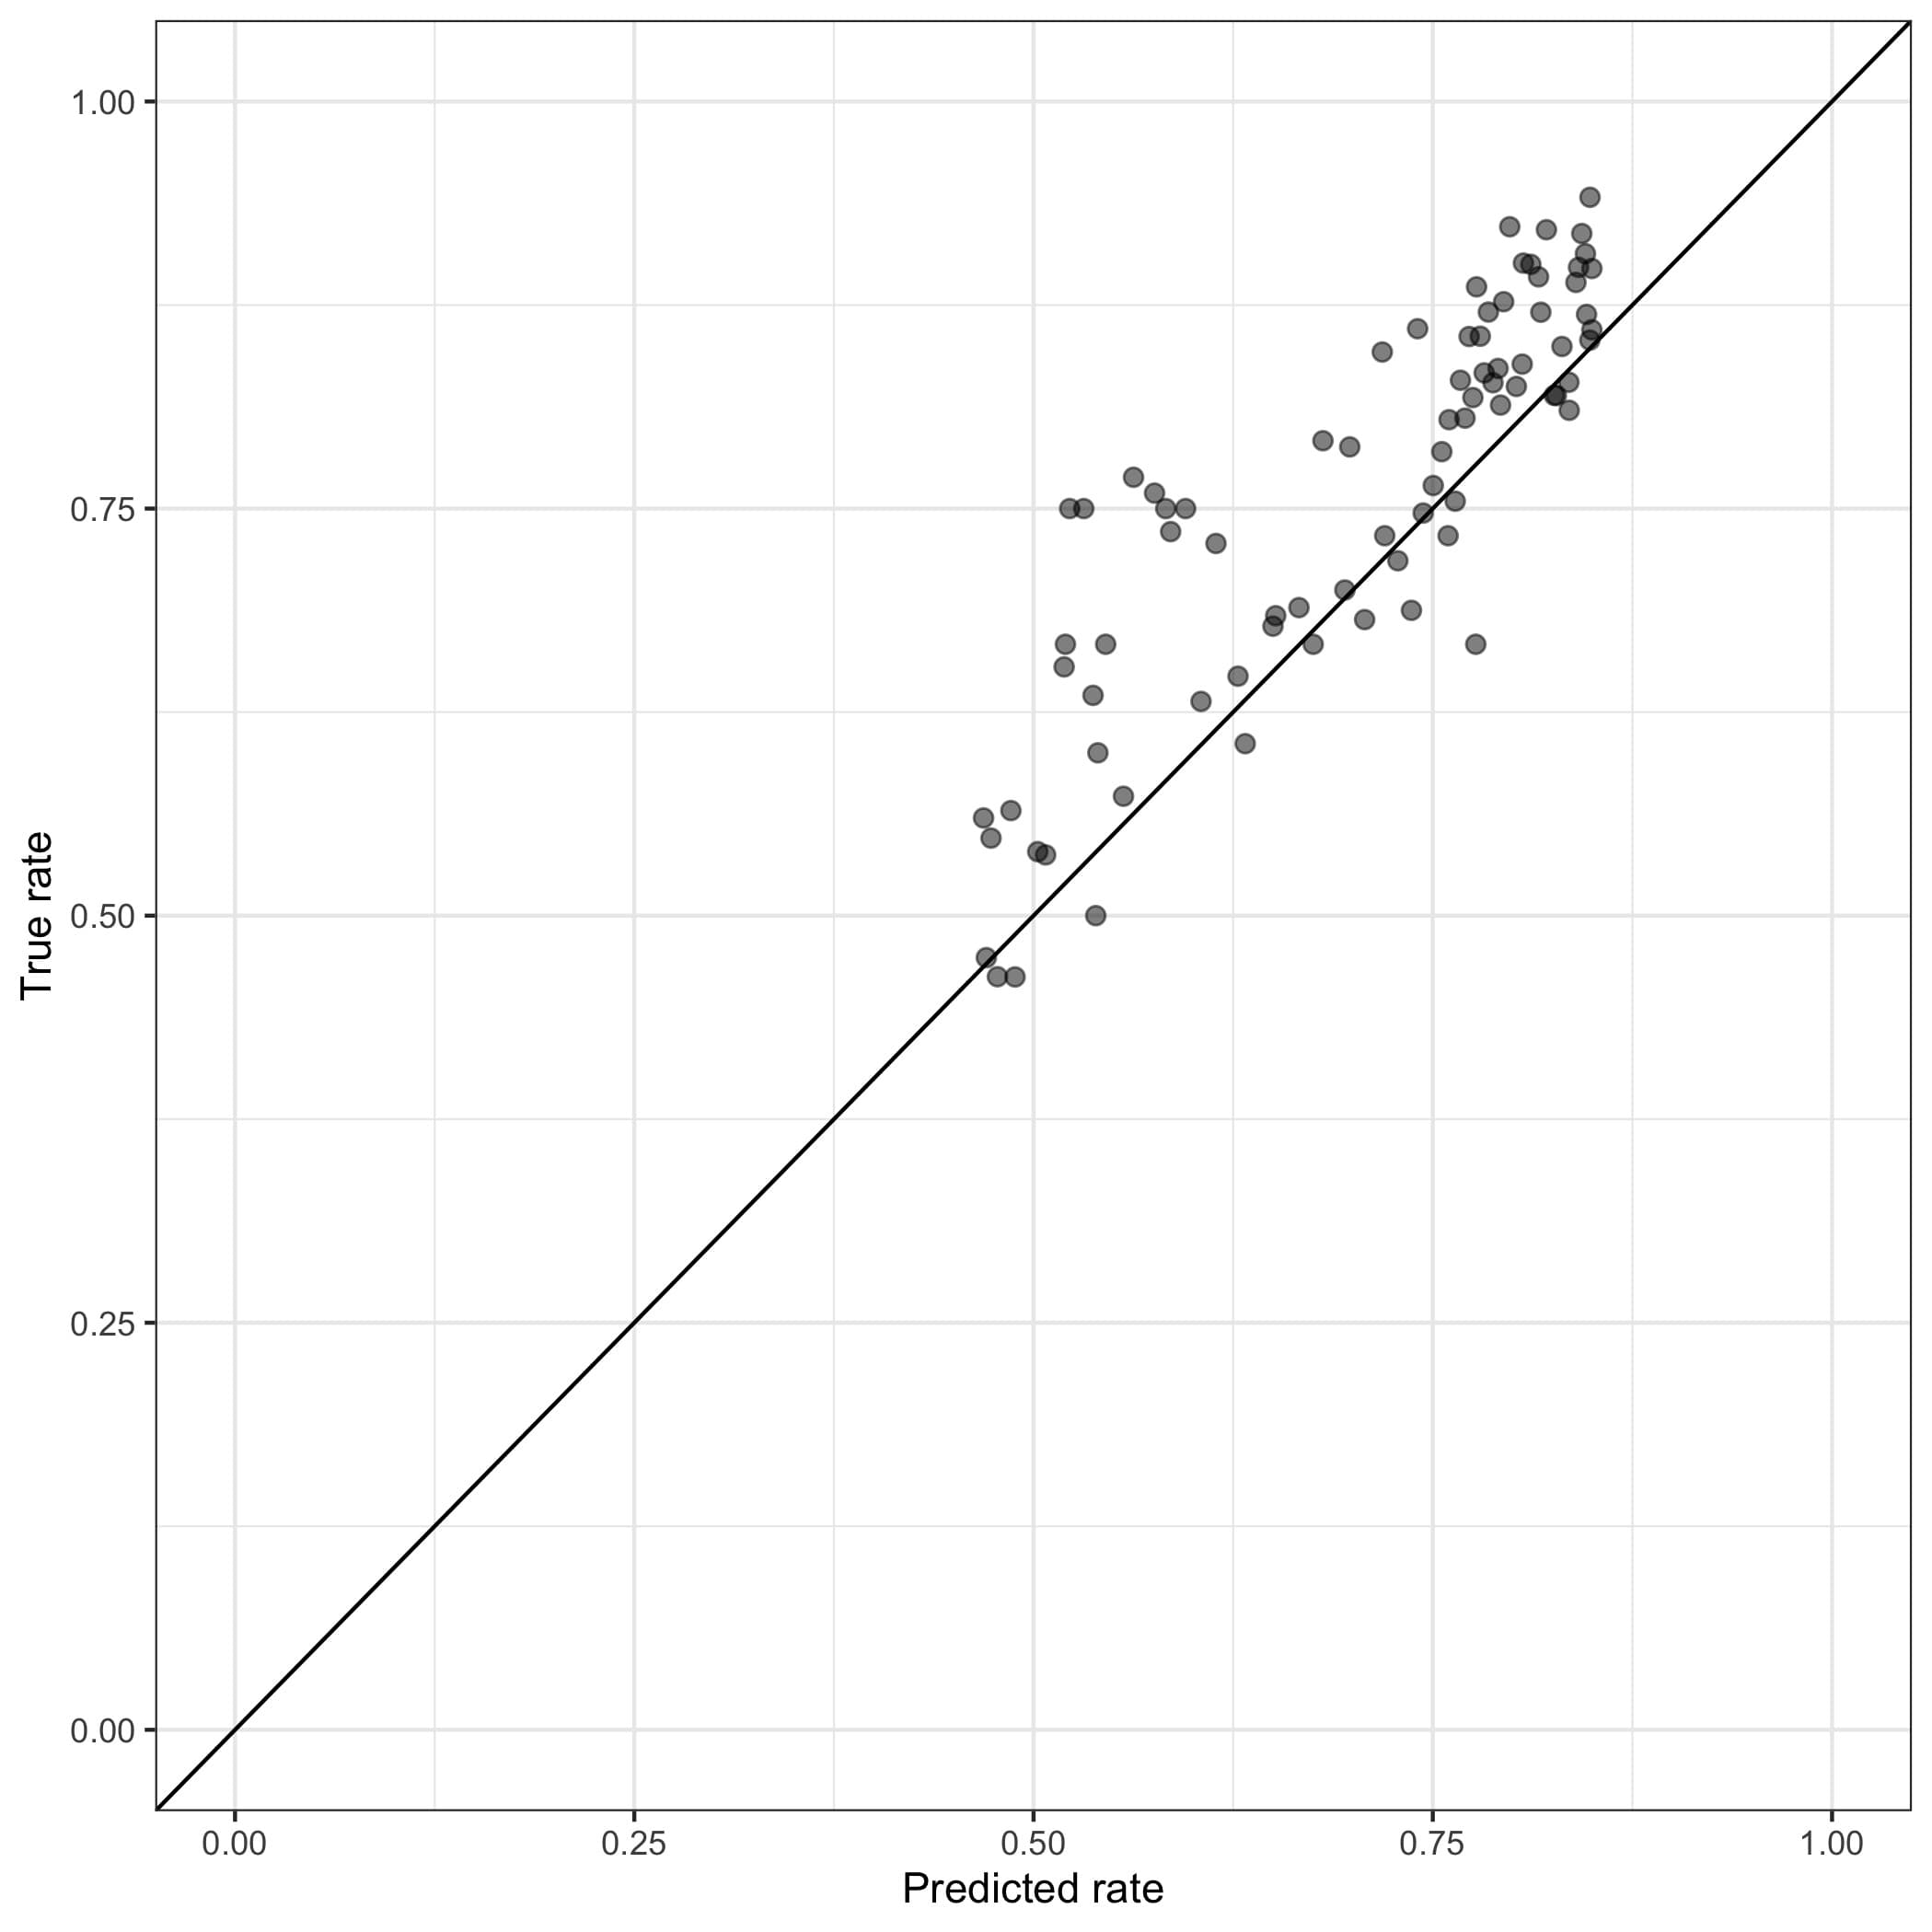
There is nothing surprising about Douglas Frank’s predictions. It is well known it is easy to predict turnout rates for age groups, particularly when focused on age-group turnout rates within a state. There will still be, however, errors in the predictions that are made.
That’s what this first plot shows: using a state-level prediction of turnout rates, we can make a reasonable prediction of the turnout rates in Little River County. These predictions, however, are far from perfect.
But when we focus on the relationship between predicted and actual turnout counts the relationship magically appears stronger. This second plot examines the predicted count using Frank’s method and compares it to the actual count. This plot merely shows the unsurprising fact that age groups with more registered voters tend to have more individuals who turn out to vote.
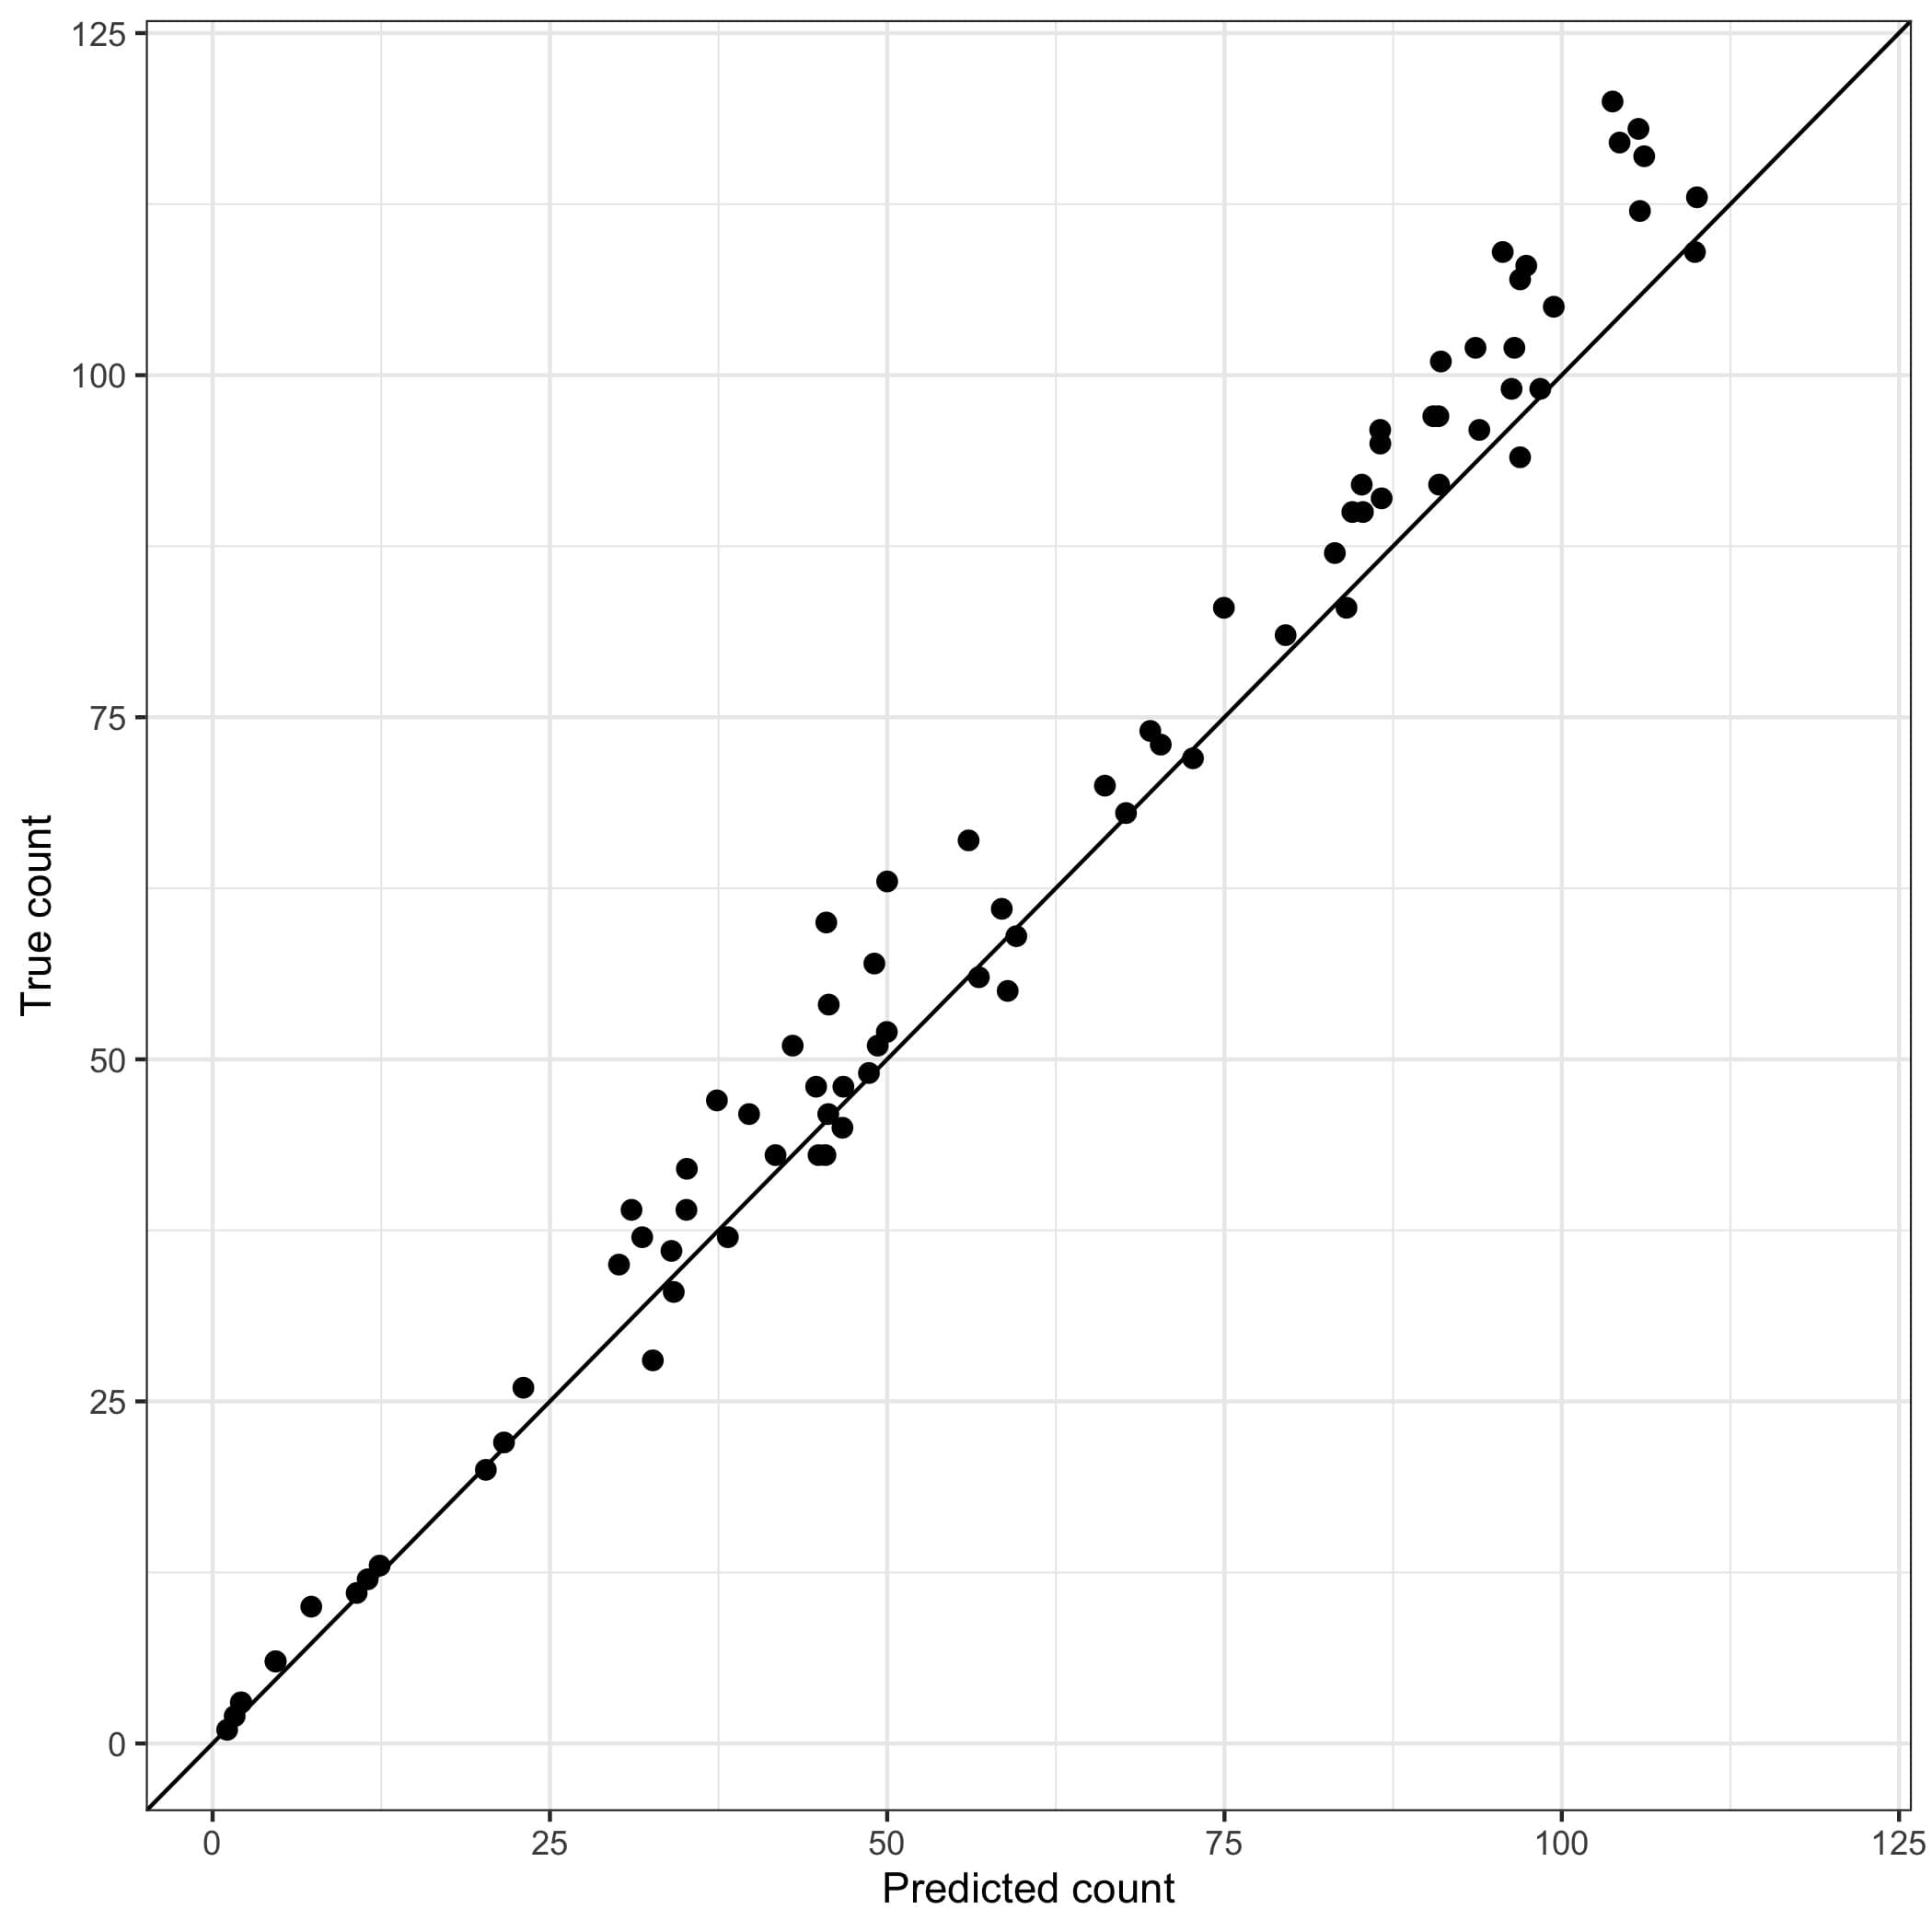
Frank calculates the correlation between his predicted number of voters from each age group and the actual number of voters from each age group. As we show on the learning page, this causes him to overstate his predictive accuracy. We can avoid this problem altogether by using a standard metric to evaluate Frank’s predictions: the mean absolute percentage error. The mean absolute percentage error describes, on average, how large the errors in Frank’s predictions are, relative to the number of people in each age group.
For Little River County, we find a mean absolute percentage error of 8.57%: this implies that Frank’s typical prediction deviates from the truth by about 8.57%.
The mean absolute prediction error is the same whether we evaluate predictions of turnout rate or predictions of turnout counts.